The airborne concentrations of SO2 gas and PM2.5 (fine particles) are measured within Hawaiʻi Volcanoes National Park and across the Island of Hawai'i (see links below).
In any location, vog concentrations are primarily dependent on the amount of volcanic emissions, the distance away from the source vents, and the wind direction and speed on a given day. The most common wind patterns in the Hawaiian Islands are the northeasterly trade winds. Consequently, the areas southwest of Kīlauea are most frequently affected by vog on Hawaiʻi Island. When trade winds are absent, which occurs most often during the winter months, east Hawaiʻi, the entire island, or the entire state can be impacted by vog.
Sulfur dioxide emissions from Kīlauea volcano have decreased substantially since the beginning of the 2008 Halema`uma`u eruption, resulting in less vog for the island and state. In general, SO2 and PM2.5 are below levels considered to cause serious health effects for the general population, however, some individuals may experience symptoms from both PM2.5 and SO2 exposures, depending on location.
SO2 and PM2.5 concentrations over the last several years:
The County of Hawaiʻi, Department of Health, USGS Hawaiian Volcano Observatory and several federal agencies worked together to form a short-term SO2 color code advisory system (see image to right), designed to alert people to volcanic SO2 pollution in Hawaiʻi. The same color code system is used by EPA for PM2.5 24-hour advisories.
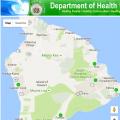
Hawaii Department of Health (HDOH) Clean Air Branch
Maps, current, and historical data of air quality conditions (SO2 and PM2.5, plus other pollutants at some locations) in the Hawaiian islands.
https://air.doh.hawaii.gov/home/map
Annual summaries of Hawaii air quality data can be found at: http://health.hawaii.gov/cab/hawaii-air-quality-data-books/
 2. Hawaiʻi short term SO2 advisory
Hawaii Department of Health (HDOH)
Current SO2 levels across the Island of Hawaiʻi.
 Hawaii Department of Health SO2 advisory levels
Suggested actions/activities at specific SO2 concentrations/color codes
http://www.hiso2index.info/assets/FinalSO2Exposurelevels.pdf
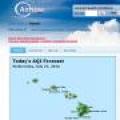
 3. AirNow particle data
Federal, State and tribal consortium
Air Quality Index based on PM2.5 particle real-time monitoring data.
http://www.airnow.gov/index.cfm?action=airnow.local_state&stateid=12&mapcenter=0&tabs=0
and https://www.airnow.gov/index.cfm?action=pubs.aqguidepart for recommended actions at specific particle concentrations (AQI)/advisory levels.
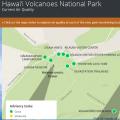
 4. Current SO2 and PM2.5 conditions in Hawaiʻi Volcanoes National Park
NPS
Map showing approximate direction of the gas plume from Halema‘uma‘u and air quality conditions for SO2 and PM2.5 from NPS monitors inside the HVNP.
https://www.nps.gov/havo/air-quality-alert.htm
NPS webcam of plume, and current and 10-day history air quality data for SO2 and PM2.5.
https://www.nps.gov/subjects/air/webcams.htm?site=havo
Archived NPS HVNP air quality data can be found at: http://ard-request.air-resource.com/
 5. Recent Kīlauea eruption update and summary, information on volcanic hazards, and weekly Volcano Watch articles
USGS
Hawaiian Volcano Observatory front page. Search the Volcano Watch archive for information about vog and volcanic gases.
 6. Webcams – Live views of Kīlauea degassing vents
USGS
Hawaiian Volcano Observatory webcams showing active degassing at Halemaʻumaʻu and Puʻu ʻŌʻō vents.
 7. PurpleAir Particle Data for Hawaiʻi Island and State
 PurpleAir air quality network
Particle concentrations for Hawaiʻi Island and State using low-cost sensors operated by the public. An evaluation of the accuracy of these monitors in comparison to federal reference methods can be found at: http://www.aqmd.gov/aq-spec/evaluations/summary